Aggregates Sizer - Applications
Aggregation Analysis System for Biopharmaceuticals

The particle amount can be quantitatively evaluated in the SVP range
Changes in particle size distribution of gamma globulin by changing PH
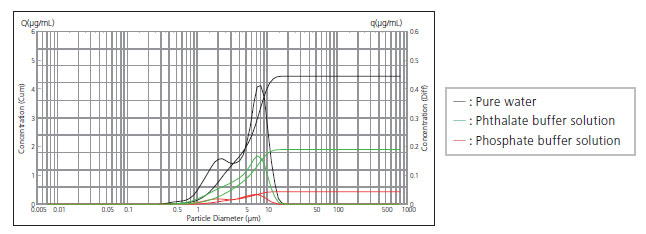
This graph shows the measurement results of gamma globulin, which is dispersed by pure water, phthalate buffer solution (PH4) and phosphate buffer solution (PH7.4).
Concentration conditions are 1 mg/mL. The size of aggregation is mainly distributed from 1 μm to 10 μm. In the case of pure water, the concentration of SVP is about 4.4 μg/mL, the largest value. In the case of phosphate buffer solution, the concentration is about 0.4 μg/mL, the least value. This ratio is more than 10 times.
Time series changes of aggregations can be confirmed quantitatively
Continuous measurement for maximum 15 hours
Changes (size and concentration) of aggregations in the SVP region can be confirmed quantitatively in minimum 1-second intervals. Therefore, time series changes as well as the difference between the status before and after aggregation can be evaluated. If differences can not be found, the sample stability can be confirmed.
POINT
Single light source optical system enables high-speed measurement in minimum 1-second intervals, enabling evaluation of time series changes of aggregations of proteins, such as biopharmaceuticals.
Accelerated test of aggregations by mechanical stimulus
Several days aggregation analysis can be reduced easily and dramatically
Changes in samples caused by mechanical stimulus using the batch cell’s stirring function can be observed. This system enables accelerated test without additional equipment and software, and this process can be used for the screening of proteins to confirm the properties of aggregations.
Inhibition effect to prevent aggregations by the L-arginine addition
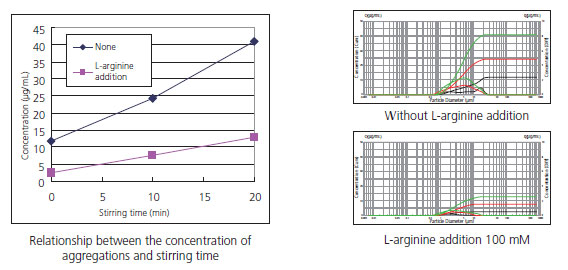
This measurement confirms that aggregation of BSA solution (Tris buffer PH5) can be inhibited by adding L-arginine. The batch cell’s stirring function can accelerate the aggregation and reduce the total observation time of this kind of experiment.
This graph shows the relationship between the concentration of aggregations and stirring time. This result shows that the addition of L-arginine can reduce aggregations.
Accelerated testing of aggregations by mechanical stimulus
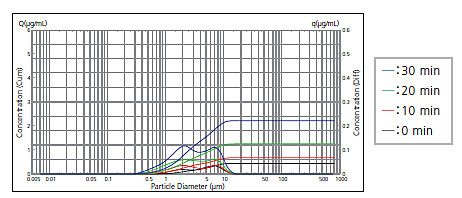
This graph shows the time series changes of aggregations in which gamma globulin is dispersed by phosphorus acid buffer solution (PH7.4) and stirred.
Stirring time: 0, 10, 20, and 30 minutes
Concentration of gamma globulin: 1 mg/mL
Stirring for 30 minutes increased the concentration of SVP aggregations from 0.4 μg/mL to 2.2 μg/mL, a more than 5 time increase in ratio.