Characterization of coal tar sample by using on-line combination of high performance liquid chromatography and comprehensive 2D GC-triple quadrupole mass spectrometry
Analytical tips (GCxGC): sample preparation and measurement
Introduction

Coal is a non renewable fossil fuel, used mainly as a source of electrical energy and in the production of coke. It is subjected to thermal treatment, pyrolysis, which produces coke as a main product, in addition to a condensed liquid by-product, called tar. Tar is a complex mixture of organic compounds which contains different chemical classes, presenting aromatic and sulphur heterocyclic compounds. In general, identification of these compounds requires off-line steps of isolation and fractionation, mainly due to co-elution of these compounds with polyaromatic hydrocarbons (PAH). An excellent way to increase the selectivity and peak capacity of a GC system is to use a comprehensive 2D GC (GCxGC) instrument. In an ideal comprehensive GC instrument, the peak capacity is equal to the product of the peak capacities (nc1 x nc2) in each dimension (usually a primary conventional column and a short secondary micro-bore capillary). However, in many cases, due to the heterogeneous nature of complex samples, it is much more convenient to isolate homogenous fractions prior to the GC analysis. It is obvious that pre-fractionation will generate simplified sub-samples, also reducing problems related to matrix interferences.
Additionally, the matrix contains considerable amounts of non-volatile material, that should be separated from the analytes of interest before GC injection. High performance liquid chromatography, coupled with high resolution GC, in an on-line mode (LC-GC), is a very powerful analytical technique because of its enhanced selectivity and sensitivity. The LC-GC hyphenation, due to the high selectivity of the LC columns, enables the separation of chemical classes, or subclasses of compounds before the GC analysis. The on-line multidimensional LC-GCxGC-QqQ MS mode is, in particular, of high interest and is effective in delivering single groups of chemically-similar analytes to a GCxGC instrument. In general, the main advantages of comprehensive LC-GCxGC-QqQ MS methods are basically four: along with the increased selectivity and resolving power, a major beneficial characteristic is enhanced sensitivity due to the solute band re-concentration to make the technique particularly suitable for trace-level component detection and finally the formation of chemically-similar compound patterns. This aspect is of great help in the identification of unknowns, when no standard components are available, in the absence of a corresponding MS library spectrum, or when the resulting experimental MS spectra are very similar to others (e.g., homologous series of compounds, such as fatty acid methyl esters or terpenes).
Furthermore, the triple quadrupole system can generate full scan and multiple reaction monitoring data simultaneously, also in a very rapid manner, enabling qualitative untargeted analysis and MRM qualitative and quantitative analysis of targeted volatiles compounds.
The analytical potential of the LC-GCxGC-QqQ MS system is herein shown in a study involving a very complex sample, namely coal tar. In Figure 1 a GCxGC-MS analysis of coal tar sample is reported to emphasize its complexity.
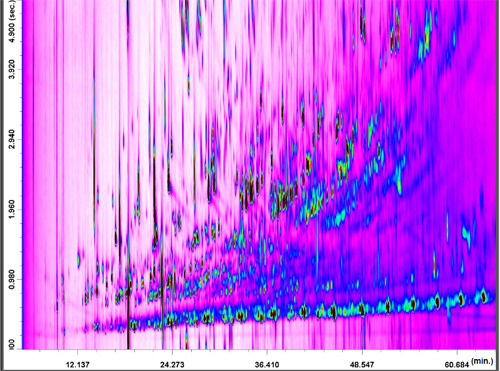
Figure 1
Thanks to the online LC-GCxGC-QqQ MS system a normal-phase LC process enabled the separation of three classes of coal tar compounds: 1) non-aromatic hydrocarbons; 2) aromatic compounds (with and without S); 3) oxygenated constituents. Each fraction was subjected to a specific programmed temperature vaporizer (PTV) GCxGC-QqQMS untargeted or targeted analysis. For example, the coal tar S-containing compounds were pinpointed through multiple-reaction-monitoring (MRM) analysis, while full-scan information was attained for the alkanes.
LC-GCxGC-QqQ MS analyses
LC separation
The separation of the three fractions was obtained by using the following LC contidions: a 100 x 3 mm ID x 5 μm dp silica column (SUPELCOSIL LC-Si, Sigma-Aldrich/Supelco) was operated under the following gradient conditions (flow: 0.35 mL/min): 0−6.5 min (100% hexane), from 6.5 to 7.5 min 100% CH2Cl2 (until the end of the analysis). LC fractions were as follows:
•nonaromatic hydrocarbons were transferred from 1.35 to 1.85 min (175 μL);
•aromatic compounds (with and without S) were transferred from 1.85 to 7.00 min (1802 μL)
•oxygenated compounds were transferred from 8.95 to 14.10 min (1802 μL).
Nonaromatic Hydrocarbons (First Fraction)
The nonaromatic hydrocarbons contained in the first fraction were analyzed only in the full-scan mode. The PTV was operated with a split ratio of 200:1 during the LC transfer period (30 seconds), plus 1 min; then, the splitless mode was applied for 1.5 min, followed by a split ratio of 150:1 to clean the liner. With regards to the GC x GC temperature program, no GC2 offset was used. As expected, the saturated hydrocarbons were aligned along a diagonal in the full-scan GC x GC-QqQ MS chromatogram (Figure 2).
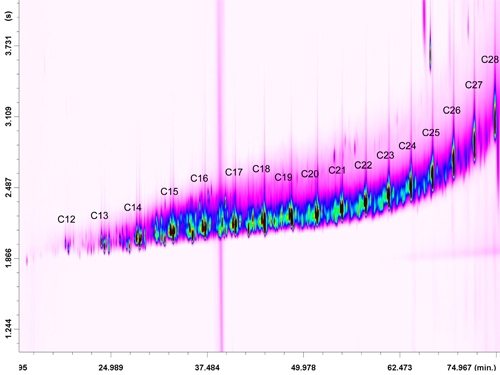
Figure 2
In this case the 2D separation in itself is of limited interest, even though the, a few considerations can be made. First, the selectivity of the LC step was certainly satisfactory, because no other coal tar constituents were present in the 2D chromatogram; second, discrimination occurred for the more volatile hydrocarbons. The linear, branched, and cyclic compounds ranged from C11 to C28.
Aromatic compounds (with and without S) (Second Fraction)
The second fraction is mainly formed of aromatic compounds, with and without S. The following PTV conditions were applied: a split ratio of 250:1 during the LC transfer period (1.85 to 7.00 min), plus 1 min; then, the splitless mode was applied for 1.5 min, followed by a split ratio of 150:1 for the remaining analysis time. While regarding the GC x GC temperature program, a positive GC2 offset of 10 °C was applied. Regarding the MS applications, both full scan and MRM were performed.
Thanks to the positive offset the bidimensional space is well-occupied with wrap-around occurring only for the pyrene class; moreover, the chromatogram was characterized by a high degree of structural order: chemical classes are grouped together on the basis of the number of aromatic rings (benzene, naphthalene, etc.) and MW of the alkyl substituent(s). The full-scan GC x GC-QqQ MS chromatogram of the second fraction is shown in Figure 3.
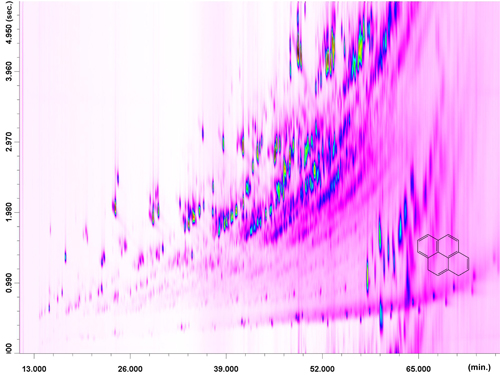
Figure 3
Initially, the MRM mode was used for the determination of aromatic polycyclic S hydrocarbons for which a commercial standard was available: one class of thiophenes, two of benzothiophenes, and three of dibenzothiophenes. MRM transitions were optimized considering each pure standard as representative of a specific class of compounds (Table 1). However, it is obvious that two isomers relative to the same class can have a slightly different response for a specific MRM transition, and so, the ion ratios reported herein (for each aromatic S class) give a good, though not entirely correct, indication. It is noteworthy that there are hundreds of isomers considering all the classes of aromatic S compounds, the majority of which are not available commercially, thus justifying such an approach. MRM information for each S class is listed in Table 1. Figure 4 shows an MRM LC-GC x GC-QqQ MS chromatogram expansion relative to the C4-T class (C8H12S), in which seven constituents were detected.
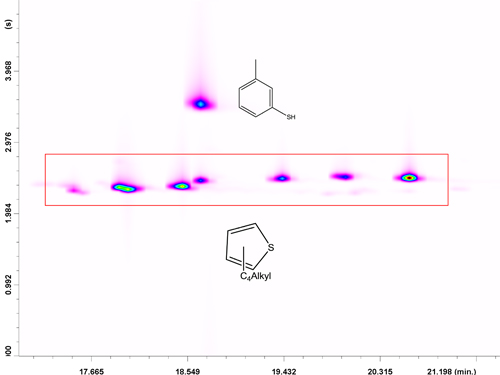
Figure 4
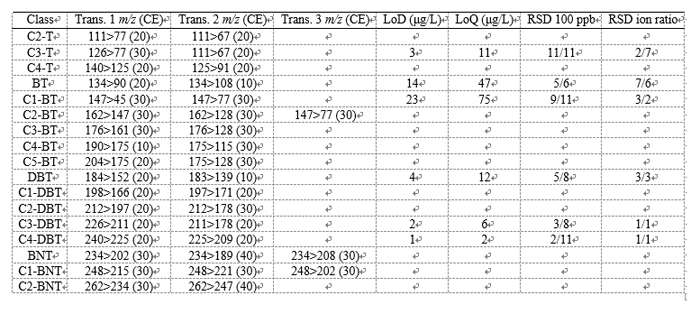
Table 1
Altogether, 129 sulfur compounds were identified (all tentatively, apart for those corresponding to the pure standards) by combining and cross-checking full scan and MRM information. The high selectivity of the MRM mode is evident: only a single “interfering” compound was present and was tentatively identified as 3-methylbenzene-thiol (C7H8S) through the full-scan information. As can be seen in the inset in Figure 4, 3-methylbenzenethiol responded only to the qualifier transition (125 > 91) of the C4-T class. In this specific case, it was the high selectivity of GC x GC that avoided a complete first-dimension coelution with peak 4 and a great deviation from the predetermined ion ratio. It is worthy of note that two-dimensional peak intensities are derived from the sum of peak intensities relative to each transition. Another chemical class, namely, DBT, is illustrated in Figure 5.
In this case, four constituents were detected, with one of these positively identified (the DBT standard was available). Apart from dibenzothiophene, the naphthothiophene class was pinpointed with the help of the full-scan information. MS database similarity matches were characterized by an average value of 91% naphthothiophenes. Considering the direct GC x GC-QqQ MS coal-tar analysis, the MS database spectral similarities were much lower for the naphthothiophene class, on average 80%. Again, it is worthy of note that the selectivity of GC x GC avoided a first-dimension coelution between DBT and a naphthothiophene.
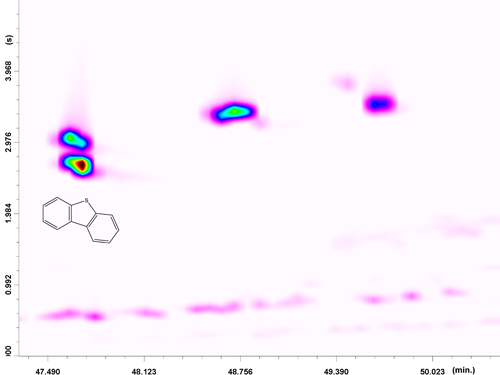
Figure 5
Analytical information was gathered through the MRM LC-GC x GC-QqQ MS analysis of standard solutions of S-containing compounds at the 100 ppb level. In each application, the volumes transferred to the GC were the same as for the coal tar second fraction. Peak area (quantification transition) intraday precision (n = 6), expressed as relative standard deviation (RSD), was between 2% and 11%; peak area interday precison, which was measured by analyzing the standard solution three times on three consecutive days, was between 6% and 11%. Ion ratio intra- and interday precision were also measured (considering the first and second transition in Table 1), with RSD values both in the range of 1−7%. Limits of detection (LoD) and quantification (LoQ) were extrapolated from the responses attained at the 100 ppb level, considering a signal-to-noise ratio of 3 and 10, respectively (n = 6). Minimum and maximum LoD values were 1 (C4-DBT) and 23 (C1-BT) ppb, while LoQ values ranged between 2 and 75 ppb. Precision, LoDs, and LoQs were extrapolated from the quantifier ion intensities reported in the native GC/MS software used (see LC-GC x GC-QqQ MS Analyses). Integer numbers were used to express LoDs and LoQs because in most cases the values derived were 2 orders of magnitude lower than the 100 ppb level and are to be considered as approximations.
Finally, it is noteworthy that the LoD/LoQ values were extrapolated by injecting only 2 μL of solution into the HPLC (the same volume as the coal tar solution). With the sample loop employed, it would be possible to inject up to a volume of 50 μL, meaning that LoQ values could be potentially reduced to the low ppt level.
Oxygenated compounds (Third Fraction)
The third fraction, containing the oxygenated compounds, was also analyzed in the full-scan mode. The same PTV conditions as for the second fraction were applied during the LC transfer period (8.95−14.10 min); With regard to the GC x GC temperature program, a positive GC2 offset of +60 °C was applied, to reduce the extensive band broadening of the O-containing compounds in the second dimension. As can be observed in Figure 6, the chromatogram is characterized by very-high complexity and by the presence of group-type patterns. As expected, the pre-fractionation process enabled the attainment of generally satisfactory MS database search matches.
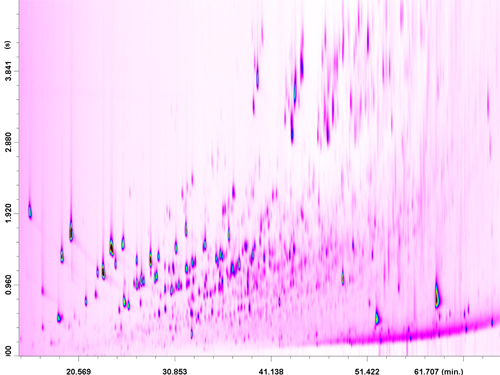
Figure 6
Identification of oxygenated constituents within a specific chemical group is not provided because many isomers with similar spectra exist. It is noteworthy that, after a direct GCxGC-QqQ MS analysis of coal tar, MS database spectral similarities were much lower (and sometimes not present at all) for the same constituents.
The on-line 5D LC-GCxGC-QqQ MS method herein proposed can be considered as a very powerful tool for the deep analysis of very complex samples, as in the reported case of the coal tar. The on-line nature of the system, compared to off-line approaches (e.g., LC//GCxGC, solid-phase extraction//GC x GC), reduces the risks of sample contamination, improves run-to-run precision, and enables the setting of batch-type applications. Moreover the system can be used in a variety of configurations, according to the analytical requirements.