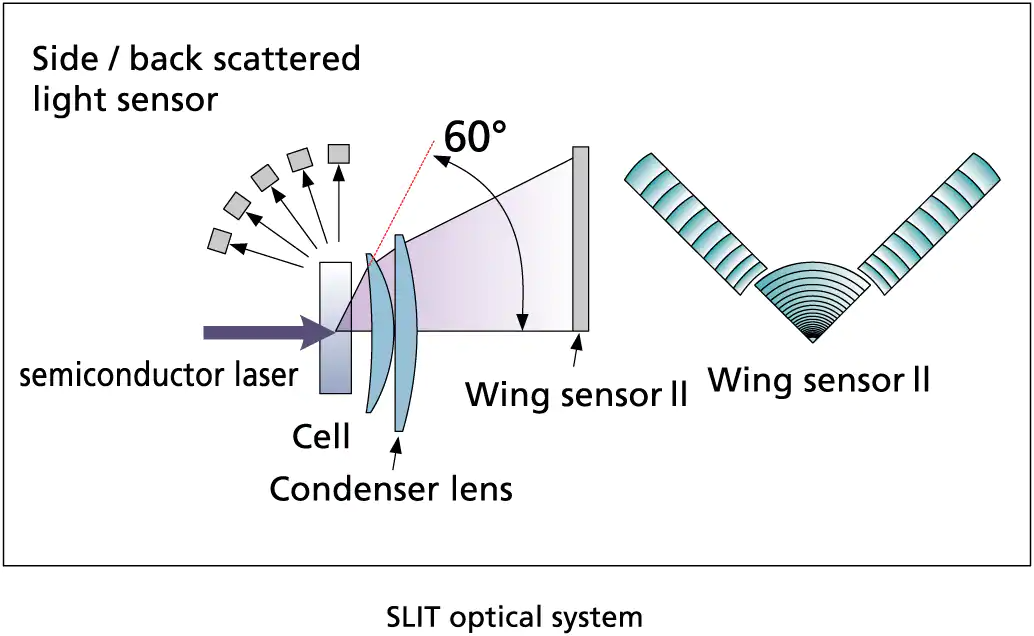
Changes in particle size across the 7 nm to 800 μm measurement range can be continuously measured using a single light source, single optical system and single measurement...
Nano Particle Size Analyzer
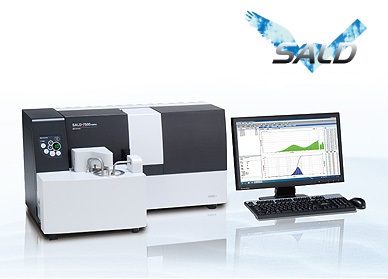
Delivering 10 times the sensitivity of previous models, this innovative analyzer is capable of continuously measuring changes in particle size and particle size distribution at one-second intervals, within a range spanning 7 nm to 800 μm. In addition, unique options that accommodate the measurement of even high-concentration samples (up to 20 wt%) and trace quantity samples (down to 15 μL) are available. Due to its leading-edge measurement capabilities, the analyzer will likely be used for many applications in new areas, including nanotechnology, the life sciences, and fine bubbles (microscopic bubbles).