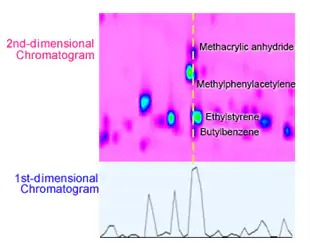
Peaks with similar boiling points that could not be separated adequately with one-dimensional chromatography can now be separated based on differences in polarity.
Comprehensive GC-MS(GC×GC-MS) System
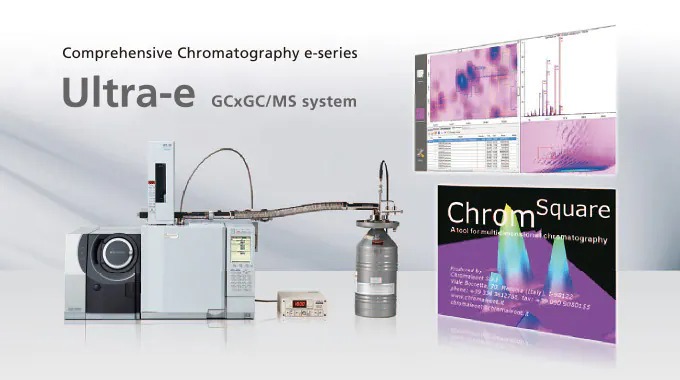
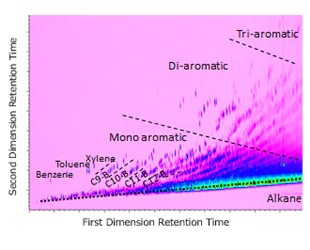
Shimadzu’s Comprehensive GC-MS (GCxGC-MS) System is suited for a variety of applications, including analysis of complex matrices such as a natural products that are hard analyze by conventional GC or GC-MS, and grouping analysis based on two-dimensional chromatograph patterns.
Nexera-e (Comprehensive Two-Dimensional Liquid Chromatograph)
Comprehensive 2DLC: Concepts, Potential, Applications
Shimadzu new products for pharmaceutical industry at Pittcon 2014